*Data of this report are based on the most recent official performance report released by each Fund. For more specific info on the funds performance please visit each funds’ home site.
Summary& Conclusion:
After comparison with world funds, GPIF Japan presents a significantly low return rate based on 2012 annual report. Majority of the global funds generate rate of return over 10%. Fund such as Yale endorsement and Harvard Management Company reported a low rate of return for 2012 because both fund aim for long term investment and majority of the asset is allocated in PE which tend to be risky. If we see their long term return rate both are very high.
Especially in 2012, funds who invested the alternative market in their portfolio earned more profit than those conservative funds such as GPIF Japan. GPIF Japan invest based on “low cost, low profit, low return” according to recent Reuter article on Abe reforms take aim at Japan’s $1 trillion pension fund, published July 1st, 2013. The article also point out that a more aggressive investment strategy is needed for a higher rate of return if the fund is planning to sustain its current aging population in 2030. Investment in the alternative investment as shown from big funds all over the world tend to be the best option currently. Investment return for real estate under CalPers portfolio made highest earning of 15.9% return compare with the other investments and 8.4% return in infrastructure. Other world funds invest at least 30% of their total asset in the alternative investment field. GPIF Japan is slowly making changes to their asset allocations, lowered its government bond asset from 67% to 60% while raise 1% in Japanese stocks from 11% to 12 %. According to Japanese news reports, the GPIF Japan in looking into investing in alternative investments.
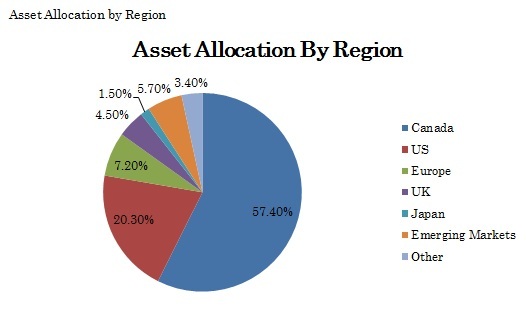
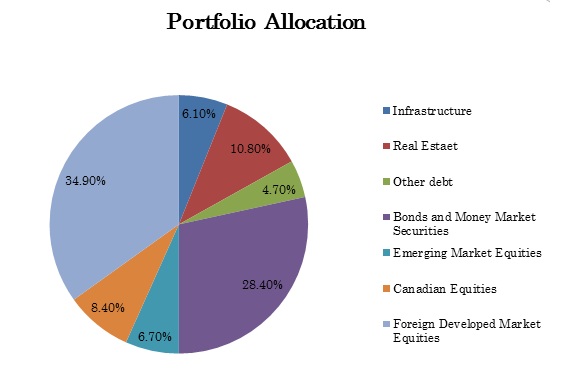
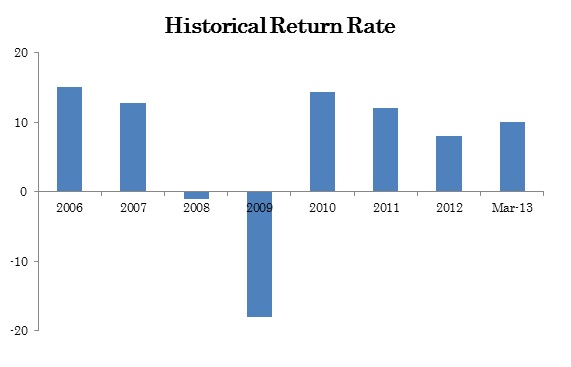
- Caisse de depot et placement du Quebec
-
Overview
Return Rate
10.7%
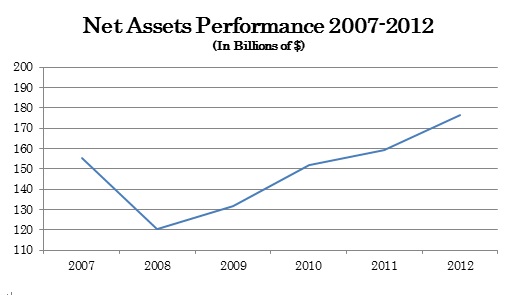
Net Asset
$176.2B
Average of 4 year return rate
9.6%
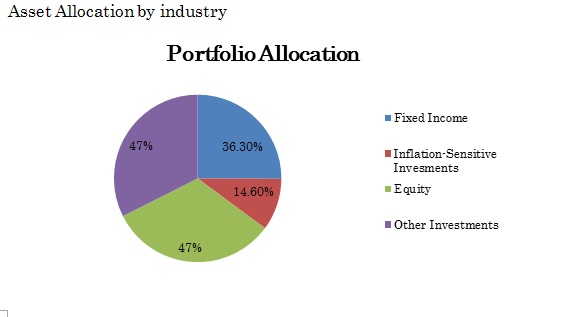
Fixed Income Includes: short term investments, bonds, long term bonds, real estate debt
Inflation-Sensitive Investments Includes: Real Return Bonds, Infrastructure, Real estate
Equity includes: US equity, PE, Global equity, Canadian Equity etc.
Other Investments include: Hedge Funds, asset allocation
- CPPIB
-
Overview2013 March. Return Rate 10.1% Net Asset $183.3B 5 year average return rate 4.2% 10 year return rate 7.4%nominal 5.5% real 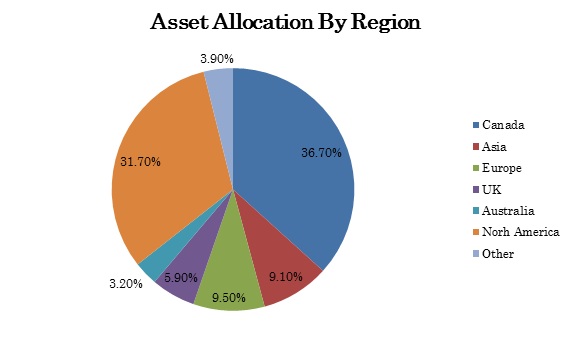
- ADIA
-
Note: 75% asset managed by external asset managers.
Overview
20 year Average Return Rate as of 2012 7.6% 30 year Average Return Rate as of 2012 8.2% 
- Yale Endowment
-
Overview
2012 Rate of Return 4.7% Net Asset $19,334.6 M Average 5 year return rate 3.08% 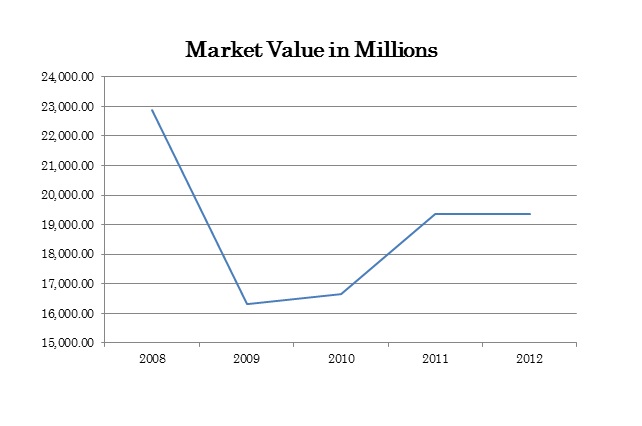
- Harvard Management Company
-
Note: Harvard Management Company aim for long term investment strategy, thus report is analyzed in long-term view
Overview
2012 Rate of Return -0.05% Net Asset $30.7B Average of 20 year return rate 12.3% 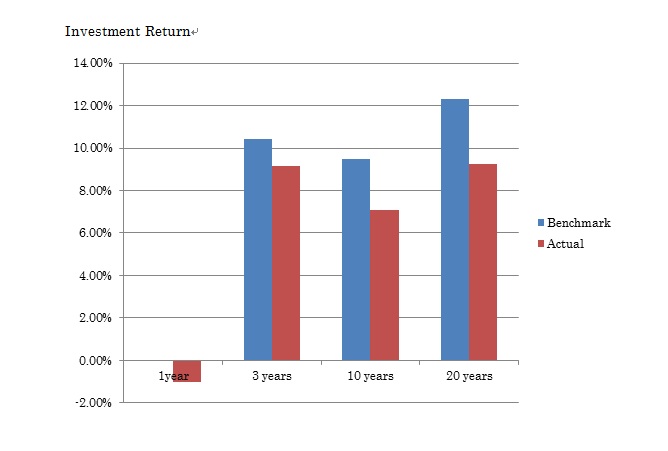
- Government Pension Global Fund (Norway)
-
Overview
Return Rate 13% Net Asset $664.81B
Investment return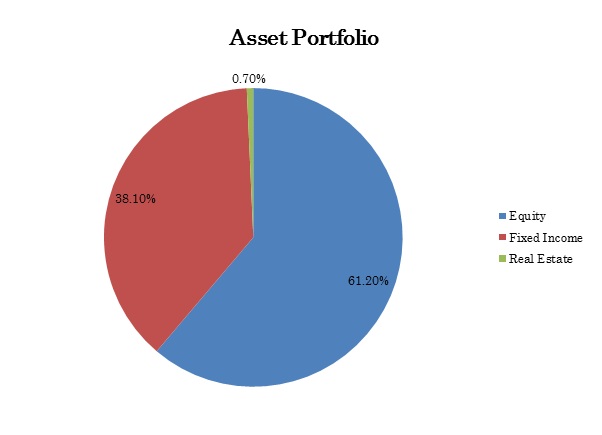
Fund total Return RateEquity Investment 18% Fixed Income 7% Real Estate 6%
1 year 13.42% 3 years 6.61% 5 years 3.14 10 years 5.99%
- GPIF Japan
-
Overview
Investment Returns2012 Return Rate 3.27% Net Asset $1119.296B
Time-weighted return 3.67% Domestic Bonds 1.48% Domestic Stocks 1.63% International Bonds 10.3% International Stocks 10.3% 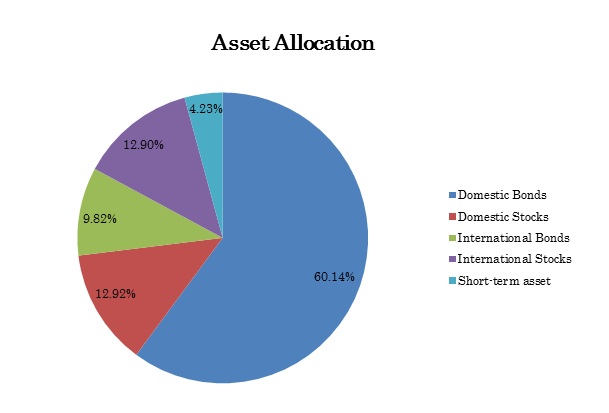
- CalPERS
-
Overview
20 Year Fund PerformanceRate of Return 1.01% Net Asset Value $233B
Rate of Return based on asset class.# Year Rate of Return Benchmark 1 1.01% 1.68% 3 10.62% 12.04% 5 .01% 2.73% 10 6.14% 7.14% 15 5.88% 6.32% 20 7.73% 7.89%
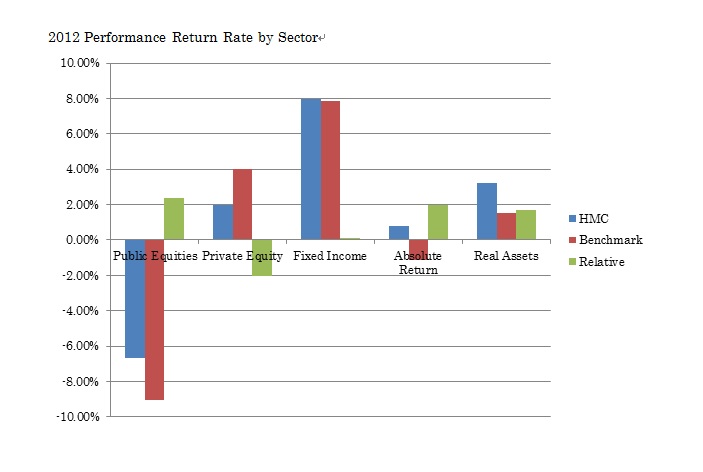
Public Equity -7.2% Private Equity 5.4% Fixed Income 12.7% Real Estate 15.9% Forestland -11.0% Infrastructure 8.4% Liquidity 4.6% Inflation Assets 0.1% Absolute Return Assets -2.0%